

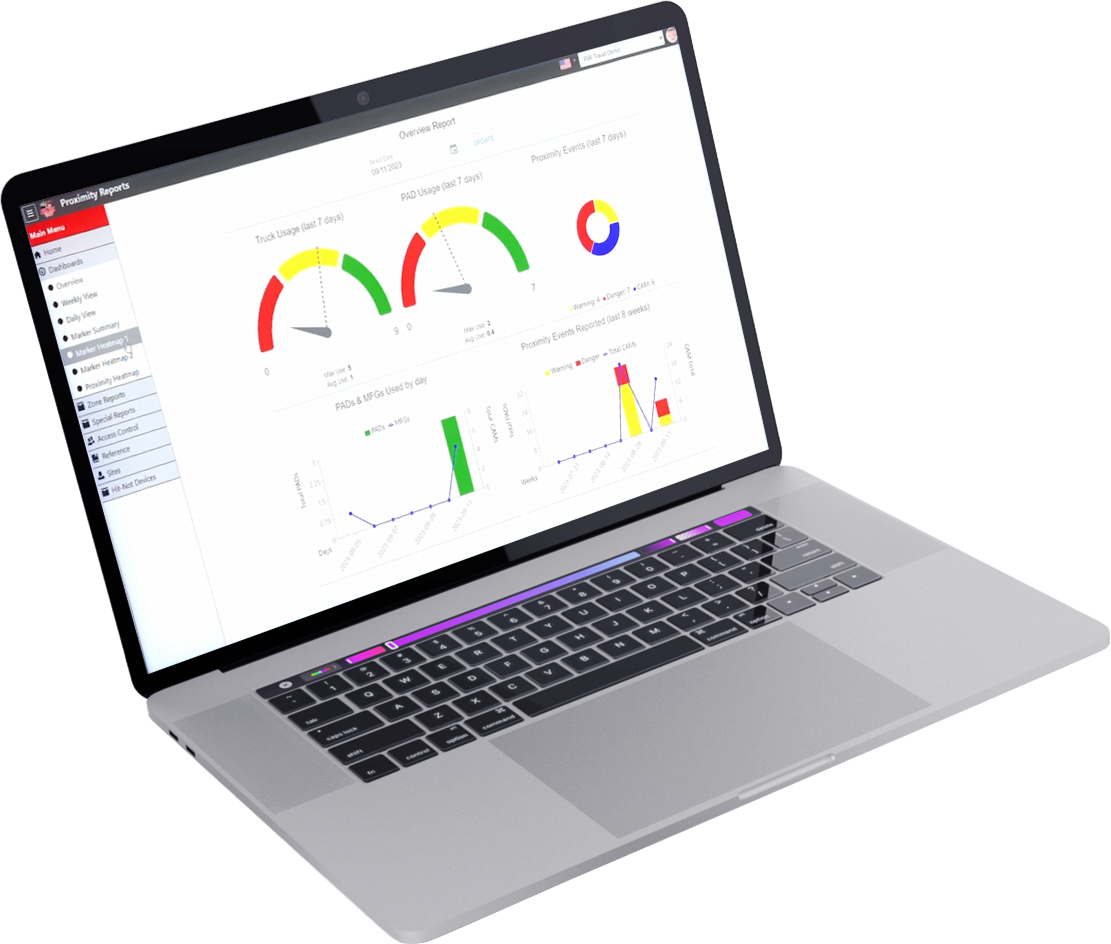
Proximity Event Monitoring Dashboard
HIT-NOT event-monitoring dashboards are built for the people responsible for what happens across your facility. Most proximity detection systems only alert after a near-miss. HIT-NOT tells you where, how often, and which equipment is involved, plus whether workers are wearing their pedestrian devices.
The HIT-NOT data dashboard can be configured for every installed system. It runs continuously in the background, logging interaction data as your facility operates. This empowers your safety, operations, and management teams with clear, actionable insights that support data-driven safety decisions and long-term risk reduction.
Track Pedestrian Alarm Device (PAD) Usage Data
A proximity detection system is only as effective as its adoption rate. If PADs aren’t being worn consistently, your exposure data is incomplete, your near-miss record is understated, and the risks surrounding forklift and pedestrian interactions are heightened.
The HIT-NOT dashboard tracks individual PAD usage for each device. Instantly see which tags are active, offline, or undetected, and compare patterns across time and zones.
This matters for several reasons beyond audit trail convenience. After a near-miss, the first question is often whether the detection system was in use. With HIT-NOT’s PAD data, the answer is documented.
When you make a case for new safety investments, sustained compliance data is persuasive. Data over weeks or months is stronger than anecdotes.
If usage drops in a specific area or shift, the dashboard highlights this before it becomes an incident.
What you can see:
- Tag activity status per shift
- Individual device history and uptime
- Usage trends by zone, department, or time period
- Flags for tags that are inactive, offline, or not returning to the charge station
Equipment-Level Visibility Into Your Forklift Safety
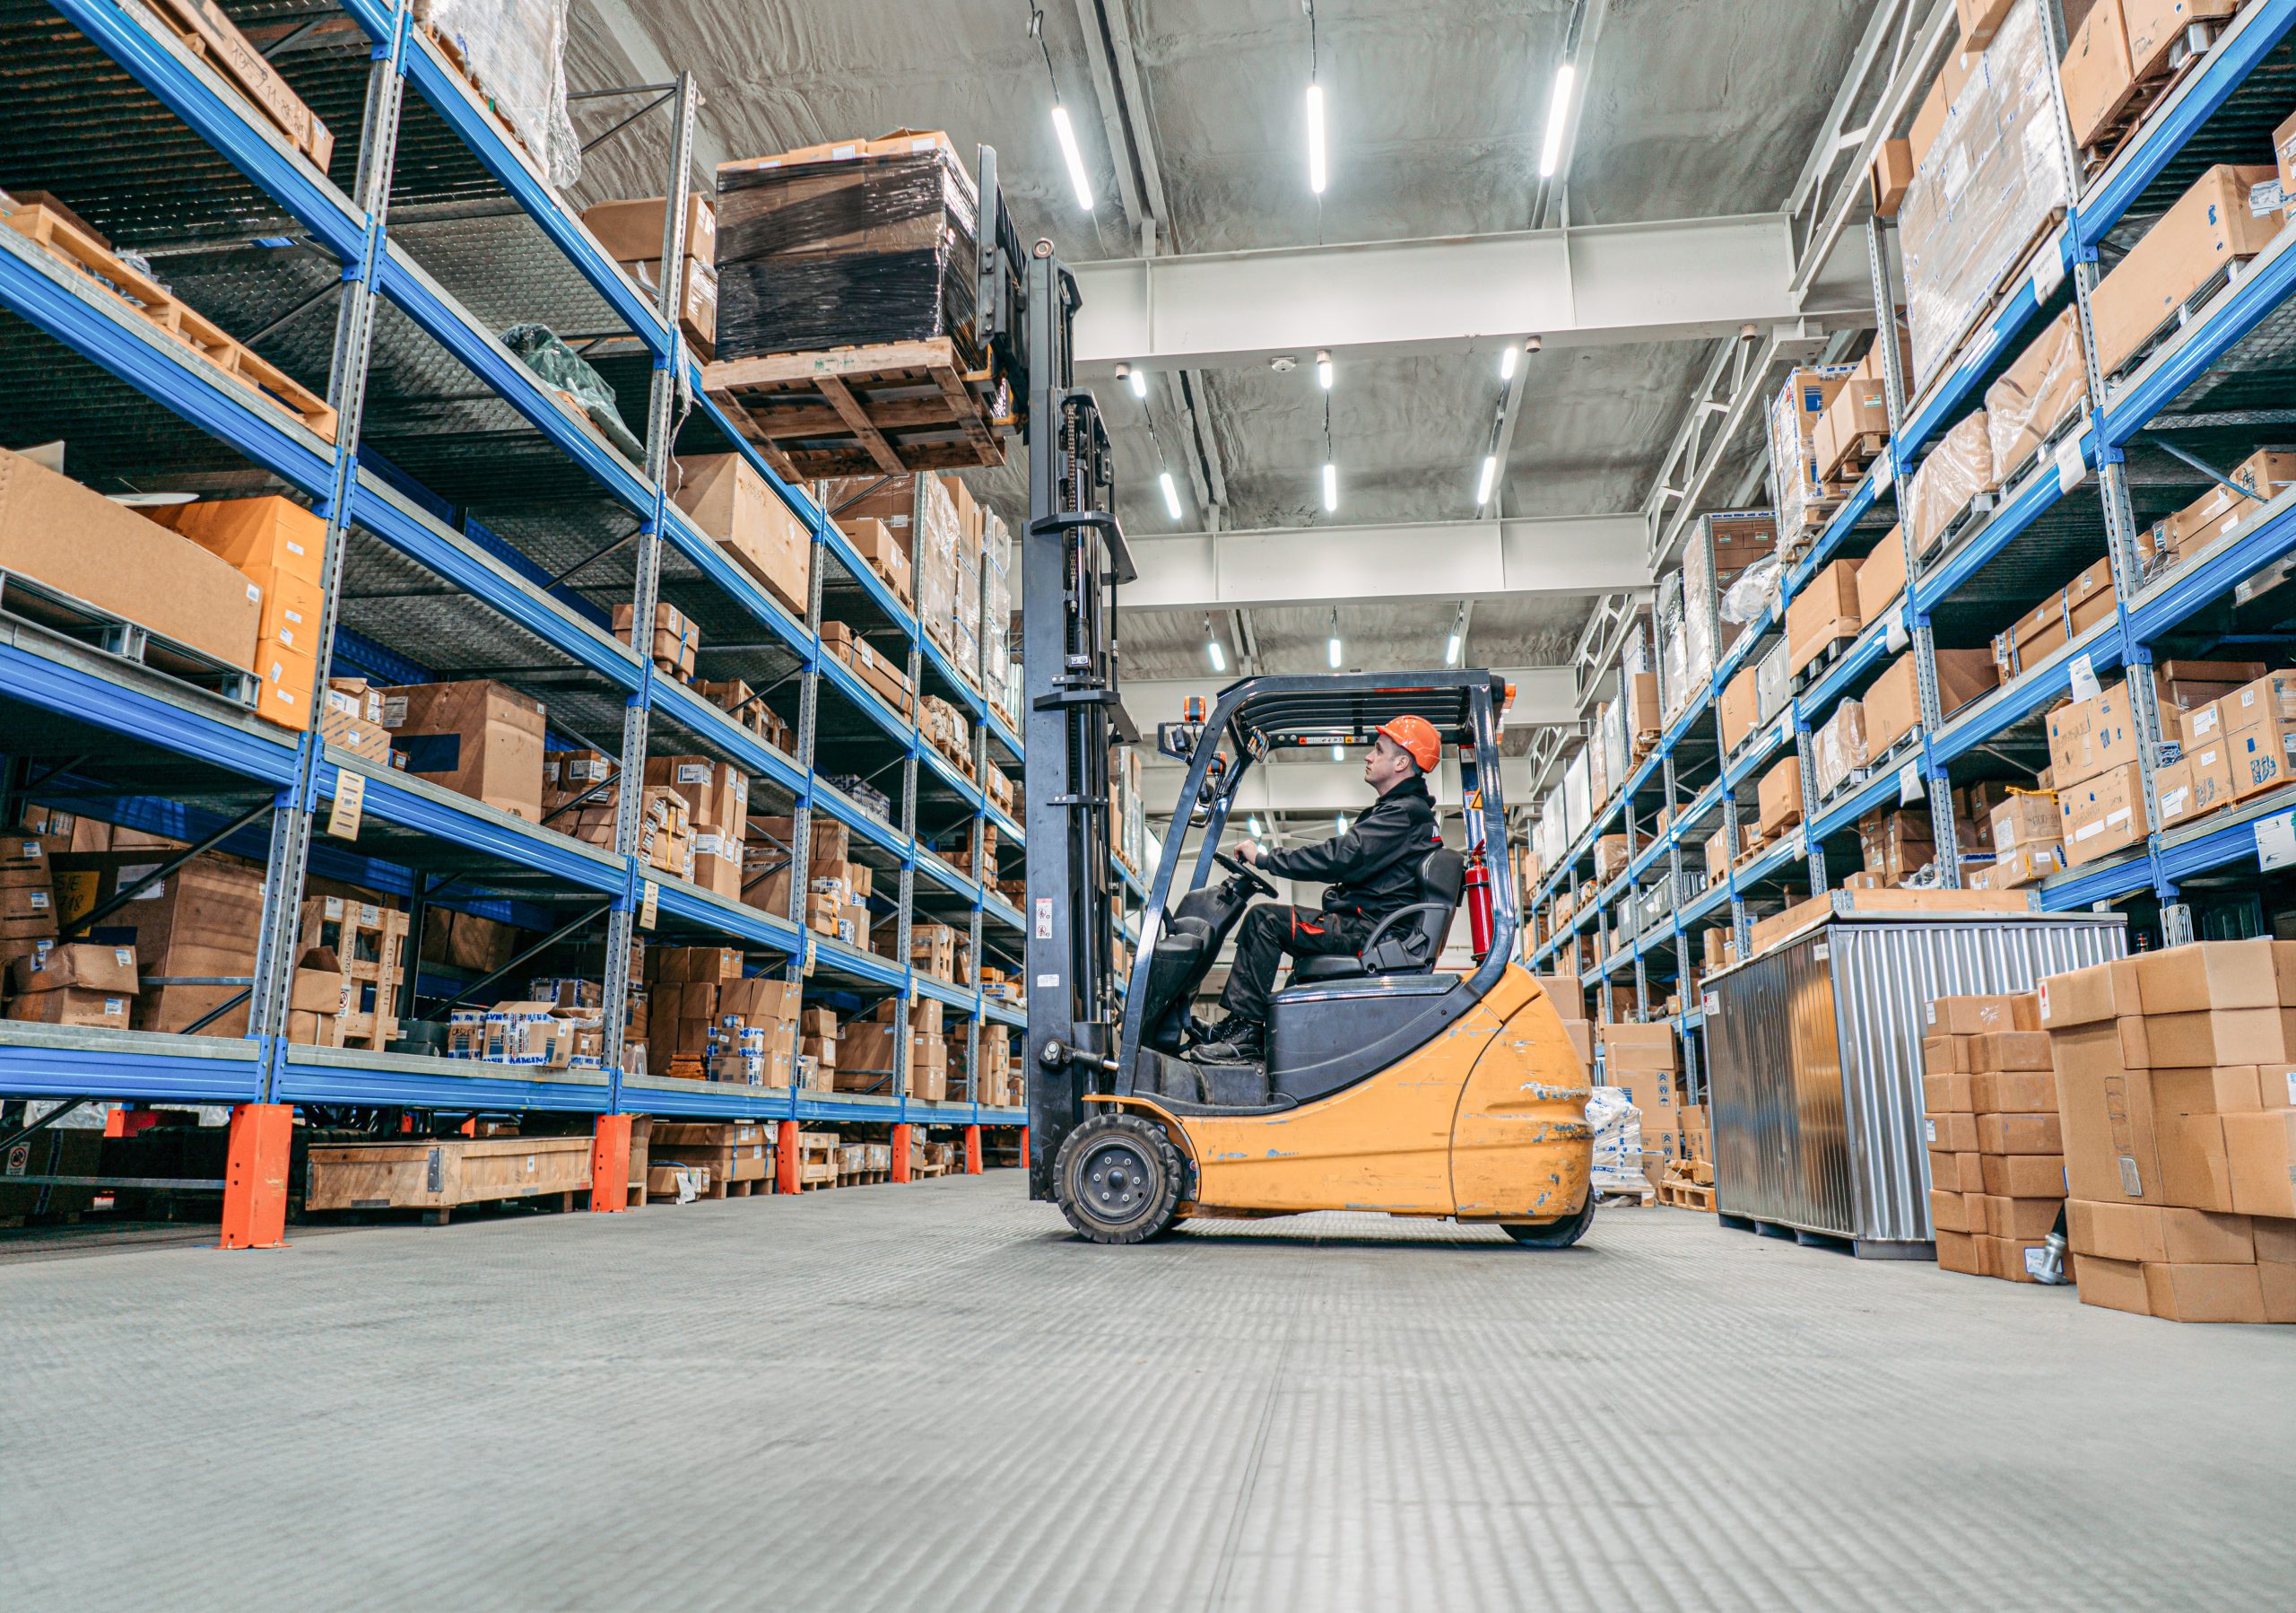
Your pedestrian data is only part of the safety picture. The HIT-NOT dashboard also tracks performance data for every Magnetic Field Generator (MFG) unit installed on your powered industrial trucks.
Each MFG unit generates the low-frequency magnetic detection zone on which HIT-NOT’s system relies. The dashboard monitors each unit’s operational status, activation history, and interaction log, so you know it’s operating correctly on every vehicle, every shift.
For facilities running mixed fleets that include sit-down counterbalanced forklifts, reach trucks, order pickers, and tuggers, this advanced level of equipment-level tracking has significant added value. A compliance gap in just one truck-type can create exposure risks even when the broader operation looks healthy.
What you can see:
- MFG unit status per vehicle
- Per-truck interaction history
- Equipment utilization compared against shift schedules
- Alerts for units that have gone inactive or show irregular behavior
- Fleet-wide coverage view for managers overseeing multiple zones or shifts
Pedestrian-to-Vehicle Interactions
Every time a pedestrian tag enters the detection zone of a HIT-NOT-equipped forklift, that event is logged. This allows you to analyze interaction patterns in detail, so you can proactively reduce risk and prevent potential incidents through timely intervention.
Not all proximity events are near-misses. Some are routine, anticipated by your facility design. Other events are unexpected, and your team needs to know about them. The dashboard helps you tell the difference. It captures data for context: which truck, which tag, what time, what location, and how the event resolved.
Quantitative data tracked:
- Total interaction event count by shift, day, week, or custom date range
- Frequency distribution — which zones generate the most interactions
- Per-truck and per-pedestrian interaction history
- Alert trigger frequency — how often the audible/visual warnings fired
A safety manager who can show a plant manager a trend line of pedestrian-to-vehicle interactions over six months — including which zones improved after a procedural change and which didn’t — is having a different conversation than one who can only say “I noticed where the system went off a few times.”
The interaction data in HIT-NOT’s dashboard supports that higher-quality conversation. It gives you the foundation for targeted safety reviews, engineering controls, routing changes, and documented continuous improvement.
Vehicle-to-Structure Interactions
Rack damage. Dock door strikes. Column impacts. Most facilities deal with these regularly and often underestimate their costs. HIT-NOT’s dashboard helps you identify patterns and address them early, adding value to facility management.
HIT-NOT’s detection capability includes data on vehicle-to-structure interactions. When an equipped forklift gets close to or contacts a structure within the system’s detection range, that event is logged. The dashboard captures and organizes that data, making patterns visible before they become structural failures, regulatory findings—or worse—worker injuries.
Quantitative data tracked:
- Structure interaction event count and frequency
- Location data — which structures, columns, racks, or zones are being contacted
- Per-truck interaction history for vehicle-to-structure events
- Trend tracking over configurable time windows
Qualitative value: Facilities that monitor vehicle-to-structure interaction data tend to catch two things early: driver behavior patterns that need corrective action, and physical layout problems that training alone will not fix. HIT-NOT data can identify both, which supports real operational solutions.
For operations teams, this data also has direct financial relevance. Structured interaction data creates a defensible cost-benefit picture that supports equipment investment decisions, layout redesigns, or targeted retraining programs.
An Ongoing Picture of How Your Facility Operates
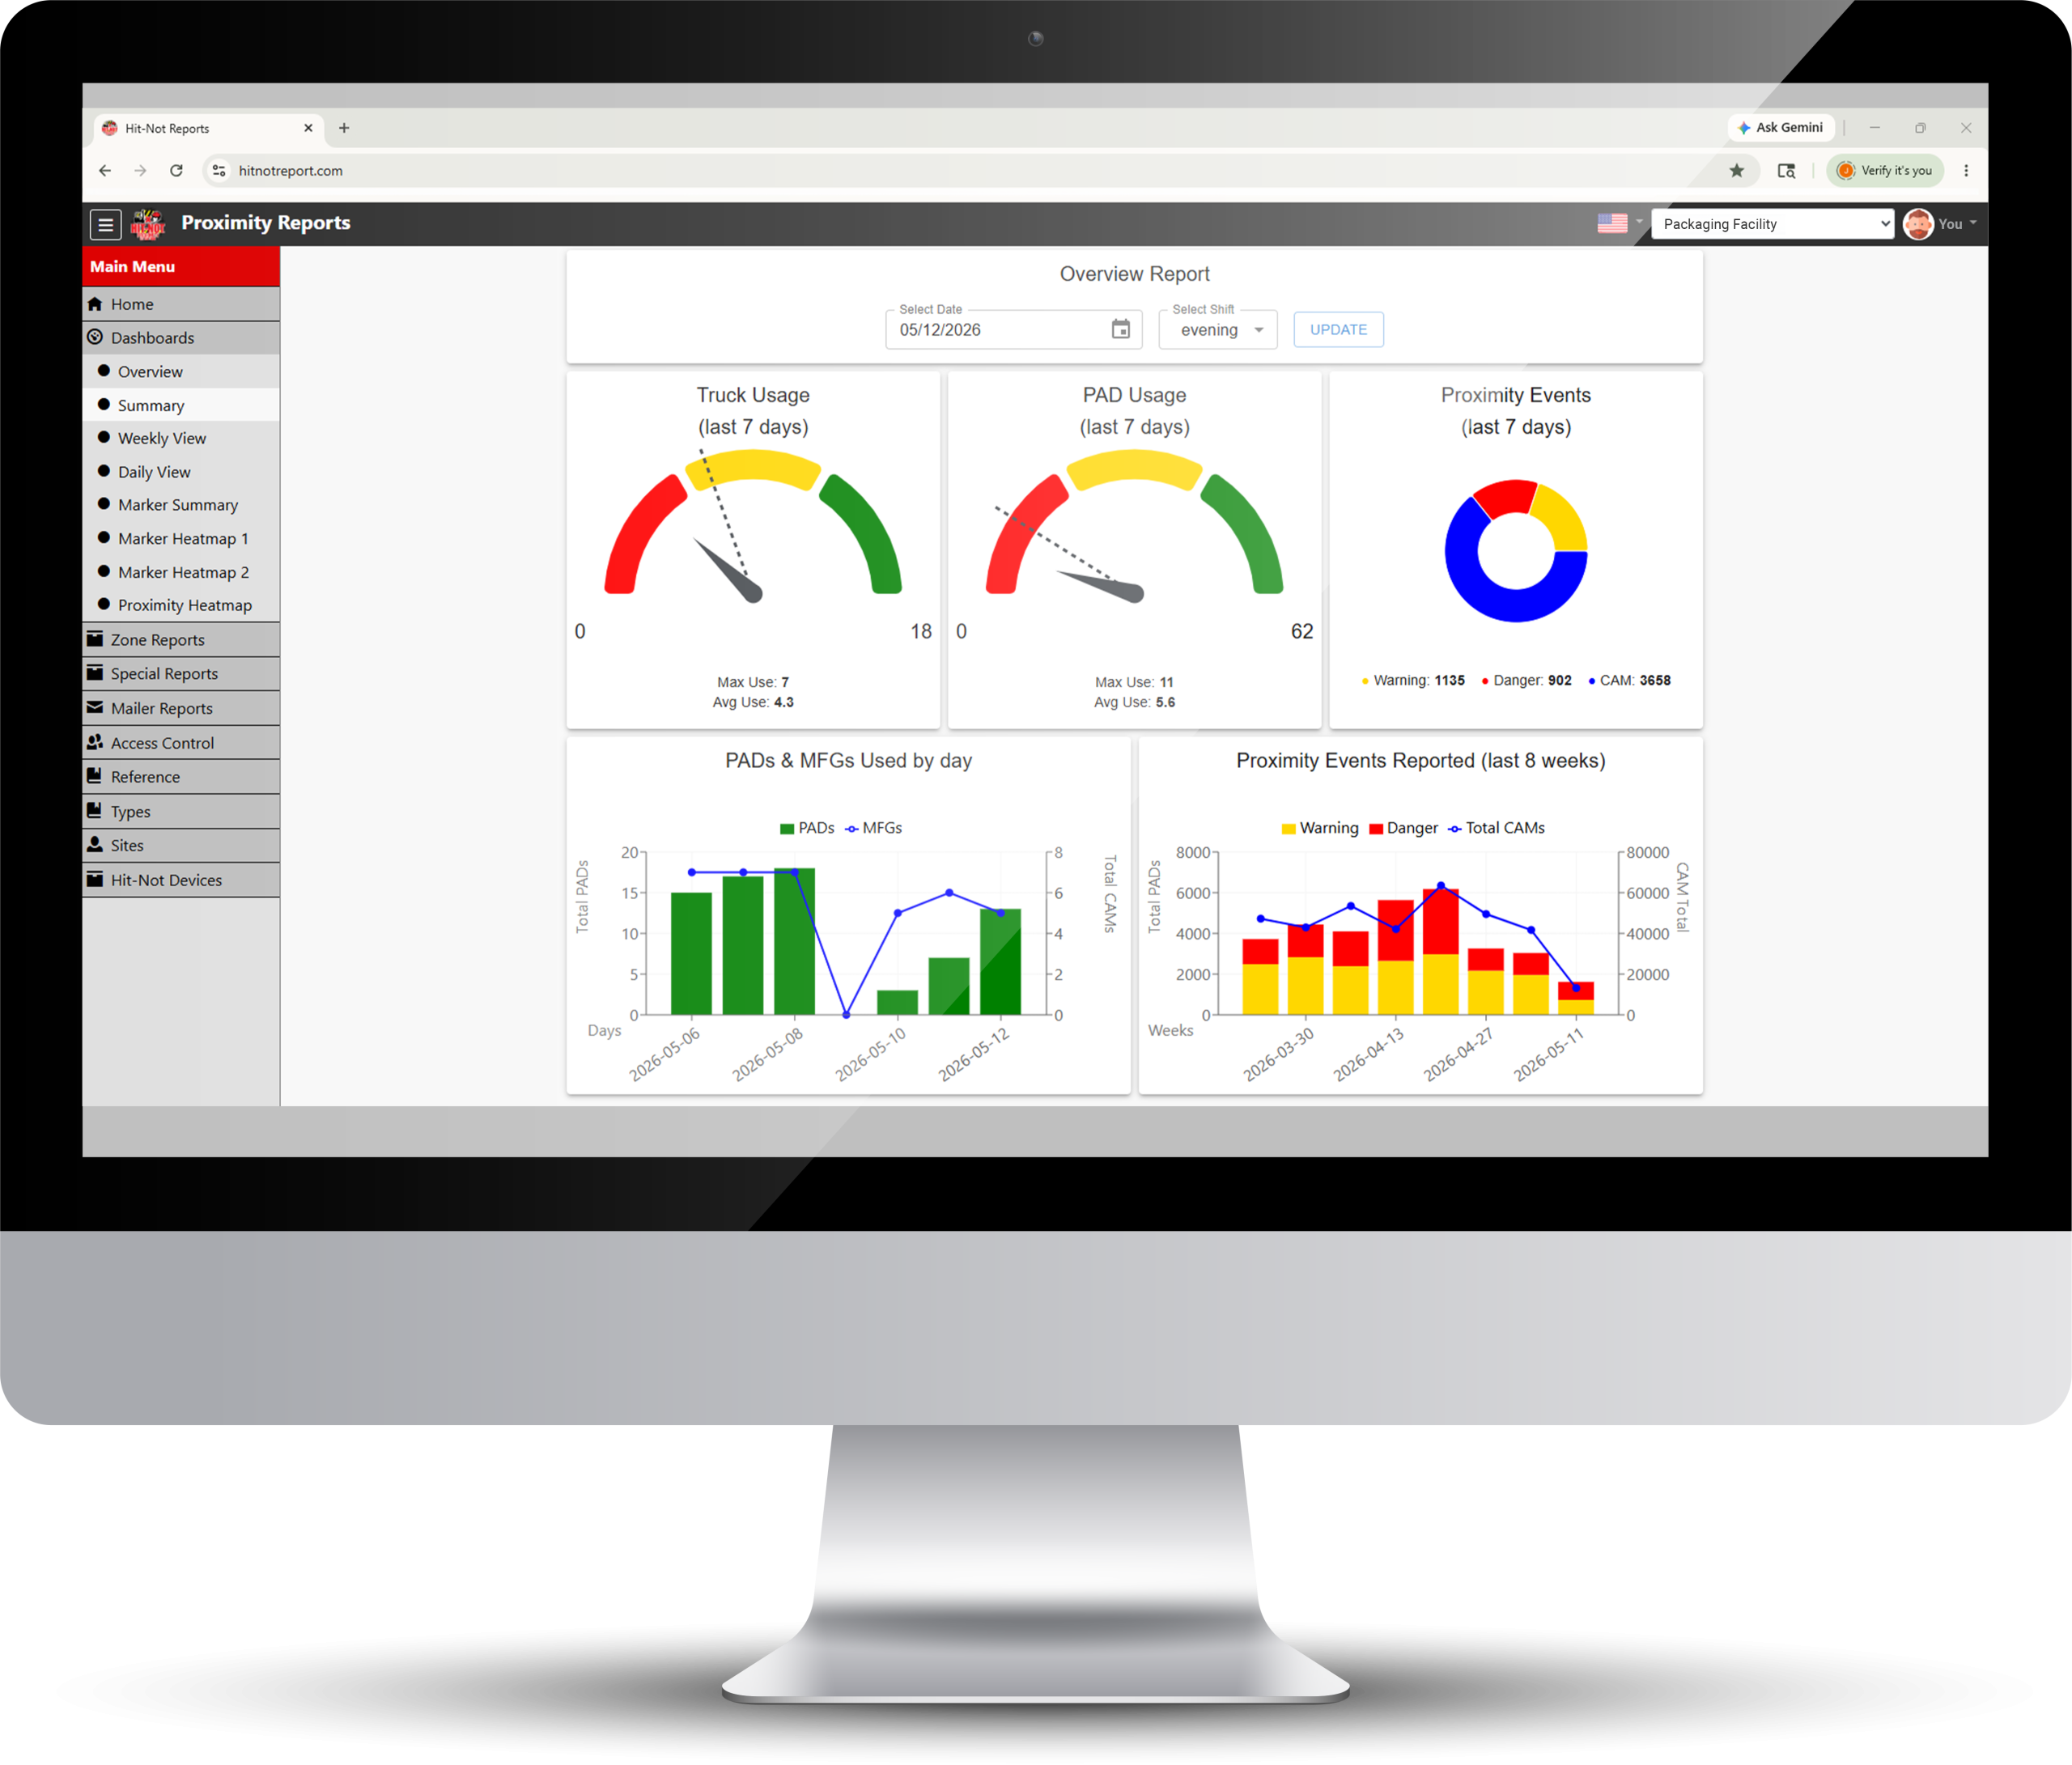
The HIT-NOT dashboard is designed to accumulate value over time. As your system logs more shifts, more interactions, and more usage data, the picture it paints becomes more specific and more useful. Compare performance across quarters, track the measurable impact of a safety initiative, or identify trends that wouldn’t be visible in any single week’s data.
For Environmental, Health, and Safety (EHS) professionals, that longitudinal data record is a professional asset. It documents a proactive safety program. It shows regulators, insurers, and internal stakeholders that your facility isn’t just hoping pedestrian-forklift incidents don’t happen; it’s watching, measuring, and responding.
For plant managers and operations leaders, it’s a management tool. Facilities that can tie safety data to operational patterns throughout shift changes, peak throughput periods, and new hire onboarding windows run a more informed operation than those that manage safety reactively.
HIT-NOT’s dashboard doesn’t require a data science background to use. The interface is built for operational and safety professionals, not analysts.
U.S.-Based Support
HIT-NOT designs, assembles, and supports its systems in the United States. When you have questions about your interaction, you’re talking to people who understand both the technology and the industrial environments where it operates.
We’re not a software company that added a hardware product. We’re a safety technology company that built a data layer because our customers needed the accountability that comes with it. The HIT-NOT dashboard reflects what facilities need to know because it was built with input from the safety leaders and plant managers who use it.
Start Tracking Your Forklift Interaction Data
The best way to understand what HIT-NOT’s dashboard delivers is to see it running against real operational data.
Or call us directly to talk through your facility’s specific configuration needs.